Difference between revisions of "StatCenter Timing analysis"
(Created page with "=== Summary === The Symbol analysis pane is aimed to provide detailed information about the various traded assets in the statement. <br>This can be used to notice some assets...") |
|||
| Line 42: | Line 42: | ||
<br> | <br> | ||
=== | === Hourly analysis chart === | ||
This chart displays all the positions related to their opening time on a hourly basis. | |||
<br>The number on the top of the bar is the total amount of trades opened during this hour. If the user hovers the mouse cursor on the green or red area, the related amount of trades will be displayed. | |||
<br> | |||
=== Daily analysis chart === | |||
This chart displays all the positions related to their opening time on a daily basis. | |||
<br>The number on the top of the bar is the total amount of trades opened during this day of the week. If the user hovers the mouse cursor on the green or red area, the related amount of trades will be displayed. | |||
<br> | |||
=== Monthly analysis chart === | |||
This chart displays all the positions related to their opening time on a monthly basis. | |||
<br>The number on the top of the bar is the total amount of trades opened during this month. If the user hovers the mouse cursor on the green or red area, the related amount of trades will be displayed. | |||
<br> | |||
=== Duration analysis chart === | |||
This chart displays all the positions related to their duration. The X-Axis represents their duration and the Y-Axis represents their growth. | |||
<br>If the user hovers the mouse cursor on a position, displayed as a dot, the related Ticket position number will be displayed. | |||
<br> | |||
<br> | |||
Latest revision as of 08:01, 23 March 2022
Summary
The Symbol analysis pane is aimed to provide detailed information about the various traded assets in the statement.
This can be used to notice some assets anomalies or underperforming financial instruments.
Hourly analysis chart
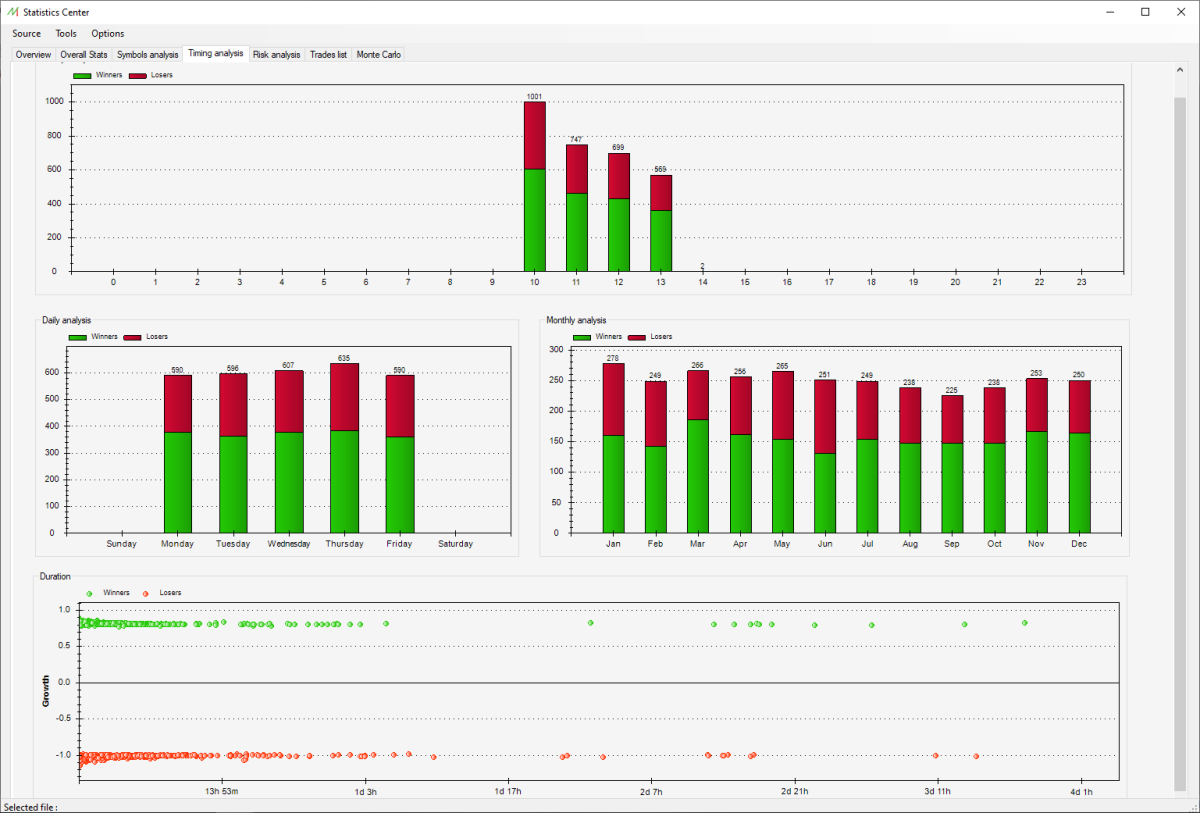
This chart displays all the positions related to their opening time on a hourly basis.
The number on the top of the bar is the total amount of trades opened during this hour. If the user hovers the mouse cursor on the green or red area, the related amount of trades will be displayed.
Daily analysis chart
This chart displays all the positions related to their opening time on a daily basis.
The number on the top of the bar is the total amount of trades opened during this day of the week. If the user hovers the mouse cursor on the green or red area, the related amount of trades will be displayed.
Monthly analysis chart
This chart displays all the positions related to their opening time on a monthly basis.
The number on the top of the bar is the total amount of trades opened during this month. If the user hovers the mouse cursor on the green or red area, the related amount of trades will be displayed.
Duration analysis chart
This chart displays all the positions related to their duration. The X-Axis represents their duration and the Y-Axis represents their growth.
If the user hovers the mouse cursor on a position, displayed as a dot, the related Ticket position number will be displayed.
