Difference between revisions of "Main interface Toolbars"
Jump to navigation
Jump to search


| (4 intermediate revisions by the same user not shown) | |||
| Line 13: | Line 13: | ||
* [[File:W1.png|frameless]] : set the Timeframe to W1 | * [[File:W1.png|frameless]] : set the Timeframe to W1 | ||
* [[File:MN.png|frameless]] : set the Timeframe to MN | * [[File:MN.png|frameless]] : set the Timeframe to MN | ||
If the user created custom Timeframes in the Data center, he can use them by clicking on the T button : | <br> | ||
If the user created custom Timeframes in the [[Data Center|Data center]], he can use them by clicking on the T button : | |||
<br> | <br> | ||
[[File:CustomTimeframeToolbar.png|left|frameless]] | [[File:CustomTimeframeToolbar.png|left|frameless]] | ||
<br> | |||
<br> | <br> | ||
<br> | <br> | ||
| Line 24: | Line 26: | ||
[[File:MainBacktestToolbar.png|left|frameless|upright=1.2]] | [[File:MainBacktestToolbar.png|left|frameless|upright=1.2]] | ||
<br> | <br> | ||
<br> | |||
The Backtest toolbar provides an easy way to access all Backtest processing tools : | |||
* [[File:BacktestNew.png|frameless]] : new [[Backtests#Backtest_Creation|Backtest creation]] | |||
* [[File:BacktestBackward.png|frameless]] : [[Backtests#Manual_processing|single step Backward]] | |||
* [[File:BacktestForward.png|frameless]] : [[Backtests#Manual_processing|single step Forward]] | |||
* [[File:BacktestStep.png|frameless]] : [[Backtests#Steps_management|set the Backtest step]] | |||
* [[File:BacktestResume.png|frameless]]/[[File:BacktestPause.png|frameless]] : pause/resume the [[Backtests#Automatic_processing|automatic Backtest processing]] | |||
* [[File:BacktestSpeed.png|frameless]] : set the speed of the [[Backtests#Automatic_processing|automatic Backtest processing]] | |||
<br> | <br> | ||
| Line 30: | Line 40: | ||
<br> | <br> | ||
<br> | <br> | ||
The Chart toolbar provides a fast access to all related charting tools : | |||
* [[File:Zoomin.png|frameless]] : Zoom in the chart | |||
* [[File:Zoomout.png|frameless]] : Zoom out the chart | |||
* [[File:EndOfChart.png|frameless]] : End of Chart, shifts the alignment to the right | |||
* [[File:GoToDate.png|frameless]] : Go to Date, jump to the selected date | |||
* [[File:LineChart.png|frameless]] : Line Chart mode | |||
* [[File:OHLCChart.png|frameless]] : OHLC Chart mode | |||
* [[File:CandleChart.png|frameless]] : Candles Chart mode | |||
* [[File:CrossTool.png|frameless]] : Cross tool mode | |||
* [[File:HorizontalLineTool.png|frameless]] : Quick access to Horizontal Line [[Graphical Objects|Graphical Object]] | |||
* [[File:VerticalLineTool.png|frameless]] : Quick access to Vertical Line [[Graphical Objects|Graphical Object]] | |||
* [[File:SegmentLineTool.png|frameless]] : Quick access to Segment Line [[Graphical Objects|Graphical Object]] | |||
* [[File:TrendLineTool.png|frameless]] : Quick access to Trend Line Line [[Graphical Objects|Graphical Object]] | |||
* [[File:ShapeTool.png|frameless]] : Quick access to Shapes [[Graphical Objects]] | |||
* [[File:FiboTool.png|frameless]] : Quick access to Fibonacci [[Graphical Objects|Graphical Object]] | |||
* [[File:ScreenshotTool.png|frameless]] : Screenshot feature | |||
Latest revision as of 07:19, 28 March 2022
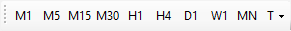
Timeframe toolbar
The Timeframe toolbar changes the Timeframe of the selected chart :
 : set the Timeframe to M1
 : set the Timeframe to M5
 : set the Timeframe to M15
 : set the Timeframe to M30
 : set the Timeframe to H1
 : set the Timeframe to H4
 : set the Timeframe to D1
 : set the Timeframe to W1
 : set the Timeframe to MN
If the user created custom Timeframes in the Data center, he can use them by clicking on the T button :

Backtest toolbar
The Backtest toolbar provides an easy way to access all Backtest processing tools :
 : new Backtest creation
 : single step Backward
 : single step Forward
 : set the Backtest step
 /
/ : pause/resume the automatic Backtest processing
 : set the speed of the automatic Backtest processing
Chart toolbar
The Chart toolbar provides a fast access to all related charting tools :
 : Zoom in the chart
 : Zoom out the chart
 : End of Chart, shifts the alignment to the right
 : Go to Date, jump to the selected date
 : Line Chart mode
 : OHLC Chart mode
 : Candles Chart mode
 : Cross tool mode
 : Quick access to Horizontal Line Graphical Object
 : Quick access to Vertical Line Graphical Object
 : Quick access to Segment Line Graphical Object
 : Quick access to Trend Line Line Graphical Object
 : Quick access to Shapes Graphical Objects
 : Quick access to Fibonacci Graphical Object
 : Screenshot feature