Graphical Objects
Overview
The Graphical Objects are designed to help the user to draw tools on the charts.
These are pretty standard and can be found in the majority of Backtesting softwares.
Graphical objects location
The most used Graphical objects are located directly in the toolbar of the main interface.
The other Graphical objects are located in the "Insert" menu.
Graphical objects list
- Cross tool : This tool displays the date and the price of the user cursor. If the user click, he can see the amount of pips between the source and the destination.
- Horizontal line : This tool displays a horizontal line on the chart.
- Vertical line : This tool displays a vertical line on the chart.
- Segment line : This tool displays a segment line on the chart.
- Trend line : This tool displays a trend line on the chart. Unlike the segment line, the trendline is never ending.
- Rectangle shape : This tool displays a Rectangle shape on the chart.
- Ellipse shape : This tool displays an Ellipse shape on the chart.
- Triangle shape : This tool displays a Triangle shape on the chart.
- Fibonacci retracement : This tool displays a Fibonacci retracement tool.
- Risk/Reward : This tool displays a dedicated tool to measure the Risk/Reward ratio related to the Stoploss and potential targets.
- Thumbs up icon : This tool displays a thumbs up icon on the chart.
- Thumbs down icon : This tool displays a thumbs down icon on the chart.
- Arrow up icon : This tool displays a arrow up icon on the chart.
- Arrow down icon : This tool displays a arrow up icon on the chart.
- Stop sign icon : This tool displays a stop sign icon on the chart.
- Check sign icon : This tool displays a check sign icon on the chart.
- Text label : This tool displays a text label on the chart.
Graphical objects properties
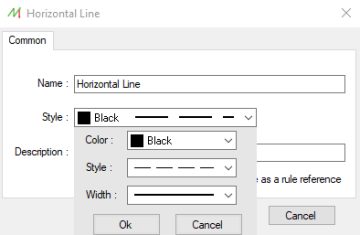
The style of each graphical object can be customized by editing its properties.
The color, the width, the style can be changed by right-clicking on it and selecting "Properties" :
Graphical objects synchronization
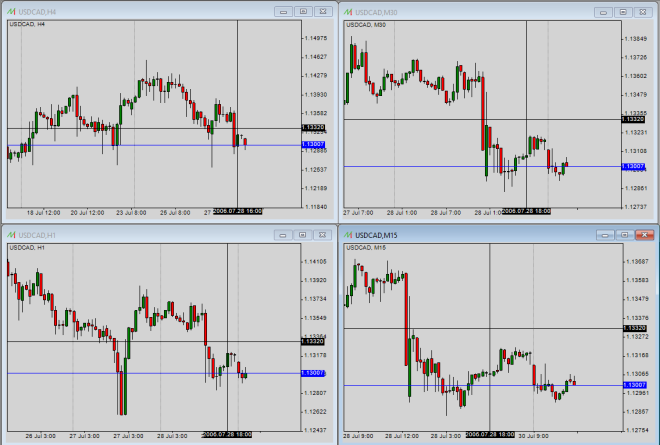
It's possible to synchronize any graphical object with other charts, displaying the same symbol.
This allows the user to display the cross tool on other timeframes, as an example :
This options can be activated or deactivated in the User settings form.
The cross tool can be synchronized and other graphical objects as well.
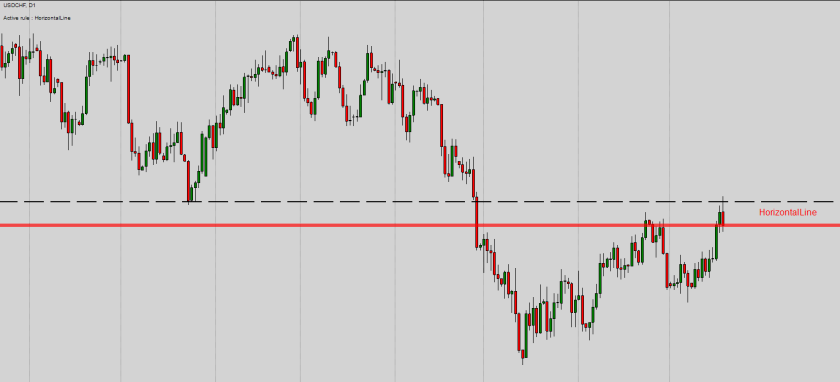
Some of the graphical objects can be included in the Setup Rules in order to defined conditions related to them.
The Rules, which are able to reference a graphical tool, are the Default Rules in the Price Breakout category.
For example, the user can define a condition where the price will reach a horizontal line, as a support/resistance level :


