StatCenter Overview
Summary
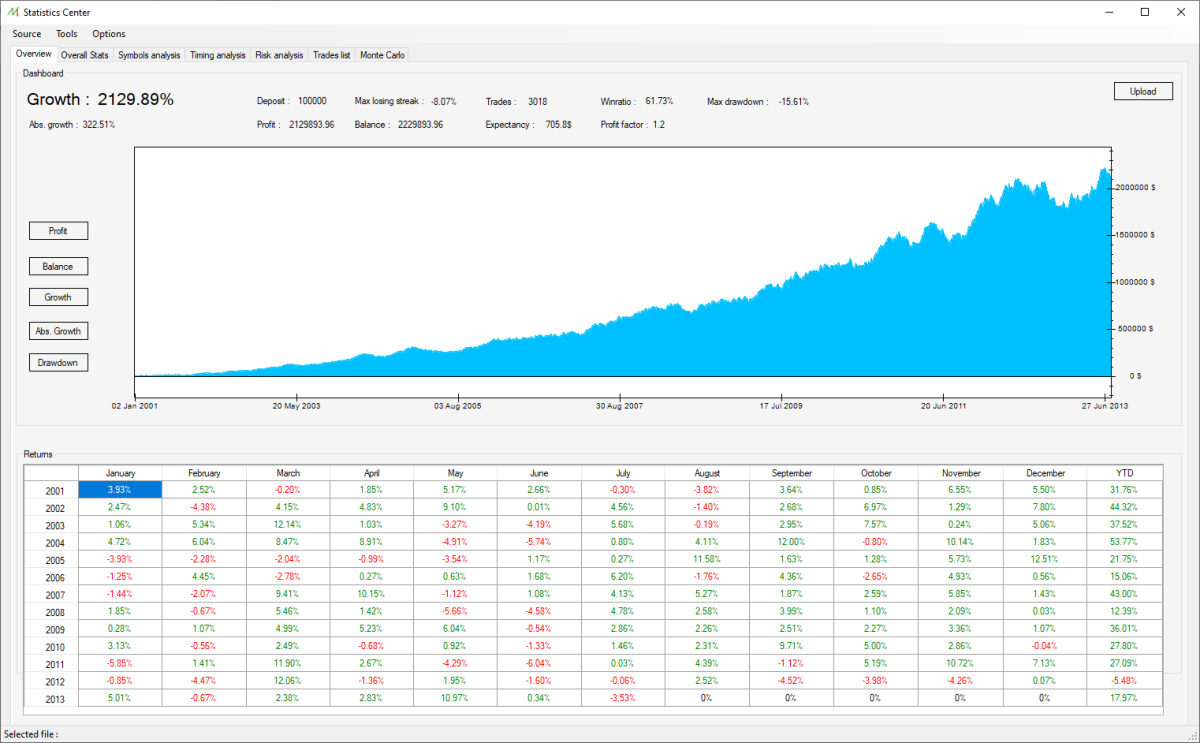
The Overview pane is aimed to provide the main information to quickly evaluate the potential of a trading system.
The most important data, statistics and the performance over the time are displayed in this module.
Dashboard
Dashboard data
Here is the list of information available on this pane :
- Growth : the cumulated growth of the trading account.
- Abs. growth : the absolute growth of the trading account. This value does not cumulate the performance over the time. It represents the sum of all trades performance.
- Deposit : the initial amount of money on the trading account.
- Profit : the cumulated profit of the trading account.
- Max losing streak : the maximum losing performance in a row. It represents the maximum consecutive losing trades in percentage.
- Balance : the ending balance of the trading account. It can be different from the profit value if positions are still opened at the end of the statement.
- Trades : the number of trades processed in the statement.
- Expectancy : the expectancy of the trading system, calculated with the following formula : (winratio * average winning trade) – (lossratio * average losing trade) in USD.
- Winratio : the percentage of winning trades.
- Profit factor : the profit factor of the trading system, calculated with the following formula : (sum of winning trades) / (sum of losing trades) in percentage.
- Max drawdown : the maximum drawdown encountered in the statement. It represents the maximum loss in percentage
Dashboard chart
The dashboard chart displays the following curves in order to deepen the analysis over time :
- Profit : the cumulated profit of the trading account.
- Balance : the ending balance of the trading account.
- Growth : the cumulated growth of the trading account.
- Abs. growth : the absolute growth of the trading account. This value does not cumulate the performance over the time. It represents the sum of all trades performance.
- Drawdown : the drawdowns encountered during in the statement.
The user can select which chart to display by clicking on the buttons on left. It's possible to zoom in on each chart to select different period of times.
By right-clicking on the charts, the software allows to zoom out or to show a grid for better readability.
Uploading data
The "Upload" button on the top-right corner provides the possibility to upload the data on our web servers.
This can be useful if the user wants to share his backtesting performance with people not owning Naked Markets, on the social media, as an example. Here is a sample of web statistics, after being uploaded.
Returns
This array of data shows the trading system performance for each month and each year.
It can be very handy to see quickly if the statement has a smooth performance or to identify the tricky periods of time.
The YTD (Year-To-Date) is the final performance at the end of each year and is calculated by cumulating the performance of each month gain.
