StatCenter Monte Carlo
Summary
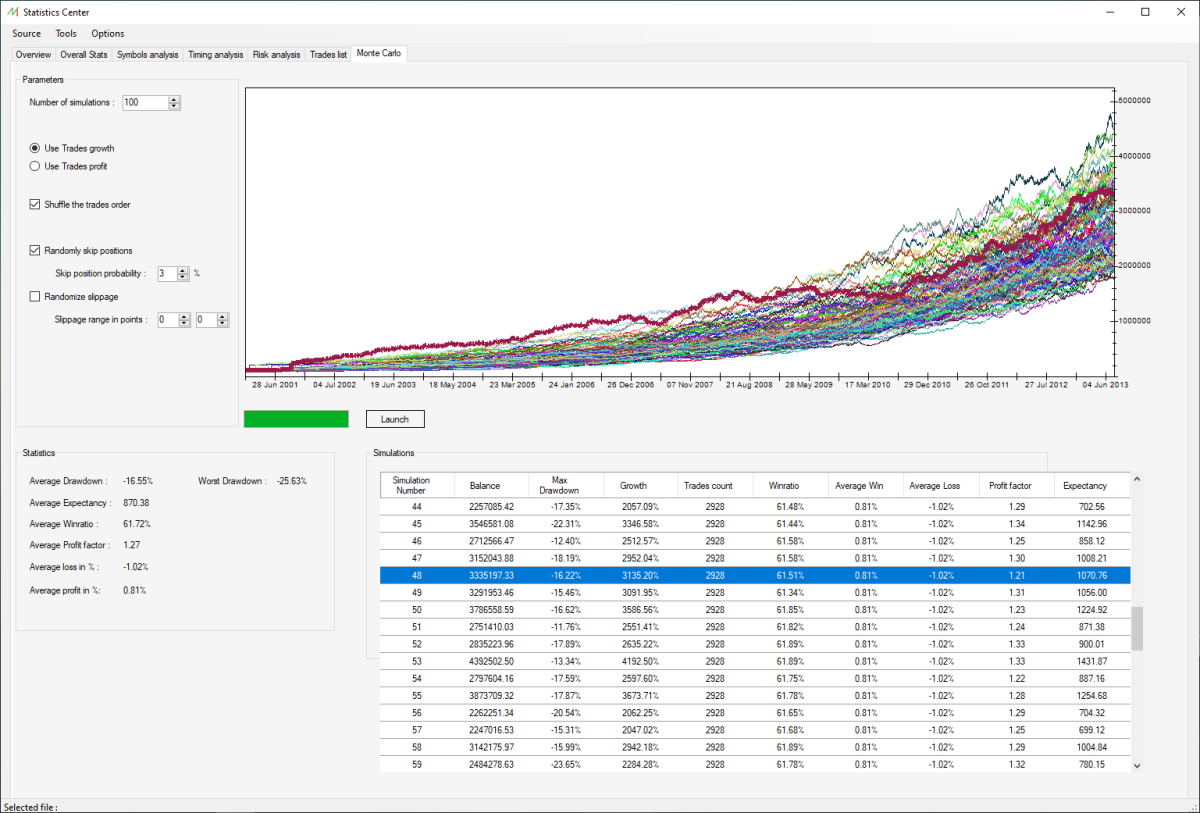
The Monte Carlo simulation allows the trader to run the statement with varying parameter in order to frame the trading system behavior under various circumstances.
This can be helpful to see the different drawdown and profit curves scenarios.
Parameters
By launching a Monte Carlo simulation, you can define the desired amount of simulations, with specific parameters :
- Number of simulations : the number of running simulations.
- Trades growth or profit : the profit processing will use the growth or the profit of each order. This can lead to different results.
- Shuffle the trade order : this option will shuffle randomly the trade orders in order to assess the trading system reliability. It can highlight the importance of several trades relating to the overall statement.
- Randomly skip positions : the user can define the amount of trades, in percentage, to be skipped to see if few trades have an important impact on the overall performance.
- Randomize sleepage : the user can add artificially sleepage to check if the trading system is sensitive to Brokers sleepage.
After having chosen the proper parameters, it's possible to launch the Monte Carlo simulations by clicking on the "Launch" button.
Statistics
Once the simulation is finished, the statistics pane will display the following information :
- Average drawdown : the average drawdown calculated from the Monte Carlo simulation.
- Average expectancy : the average expectancy calculated from the Monte Carlo simulation.
- Average winratio : the average winratiocalculated from the Monte Carlo simulation.
- Average profit factor : the average profit factor calculated from the Monte Carlo simulation.
- Average loss : the average loss per trade, in percentage, calculated from the Monte Carlo simulation.
- Average profit : the average profit per trade, in percentage, calculated from the Monte Carlo simulation.
- Worst drawdown : the worst drawdown encountered from all the Monte Carlo simulations. This information is very useful by comparing it to the maximum drawdown on the overview pane, to check if the intitial statement had exceptional or ordinary performance.
Simulations
This array lists the results of each launched simulations. If the user selects one of them, the main chart will highlight the related simulation.
For each line, it's possible to read the main statistics of each simulation to see the variance between them.
