EMA went crazy

Khan
Posts: 137
Joined: Wed Feb 22, 2023 10:21 am

EMA went crazy

Post by Khan »

Hello,

I created a new backtest and everything was normal. I just moved a few steps and the EMA decided to take a vacation. :D
Screenshot 2023-12-04 191013.png
Screenshot 2023-12-04 191013.png (14.52 KiB) Viewed 26993 times
Attached is the backtest file.

Cheers.
Attachments
GER30.zip
(110.01 KiB) Downloaded 956 times
Khan
Posts: 137
Joined: Wed Feb 22, 2023 10:21 am

Re: EMA went crazy

Post by Khan »

Update:

After some time, while backtesting, the EMA went back to normal. Probably changing the time frame caused a recalculation and fixed it; too bad I didn't notice it in time.

The cause of the bug might be the fact that the start date of the backtest being 01.01.2023, which is a holiday and missing from the chart. The last value was probably 0, which made the EMA take a nose dive.

I have seen this bug multiple times by the way. It might be because I usually start my backtests on the 1st of Jan.
Khan
Posts: 137
Joined: Wed Feb 22, 2023 10:21 am

Re: EMA went crazy

Post by Khan »

Okay, I managed to isolate the problem.

Backtest attached. You'll see that there is 1 min left to current bar's close. Set time frame to H1 & the step value to M1 and step forward once. EMA will go through the floor.

There is one more related bug. After you step forward, the last 'tick' comes and the bar closes. Then, the next bar opens, but time remaining on the next bar starts to count down from 4 hours, rather than 1 hour. When that bar closes, next bar shows 30 mins left, which is also wrong.

When you step forward once more (again for M1), then the chart jumps down but there is no bar visible:
Screenshot 2023-12-04 225541.png
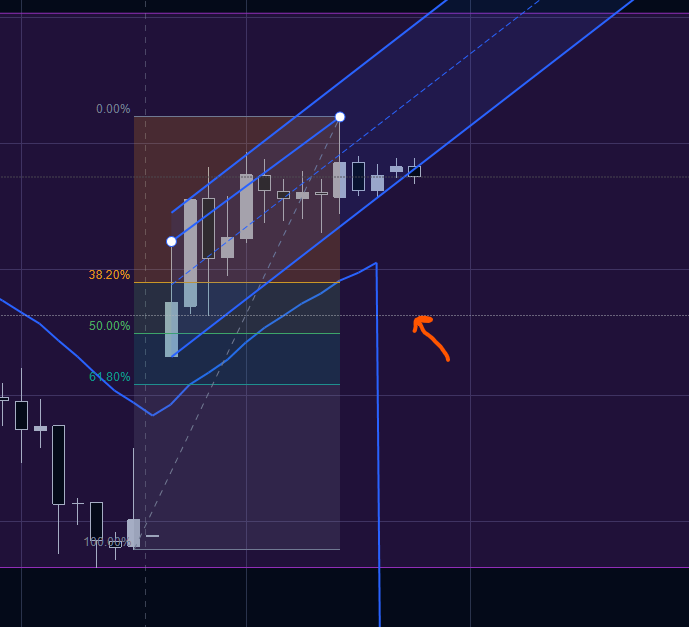
Screenshot 2023-12-04 225541.png (39.89 KiB) Viewed 26985 times
Red arrow shows where current price is.

Only after that bar closes after 30 mins, the next bar becomes visible and counts down from 1 hour:
Screenshot 2023-12-04 225822.png
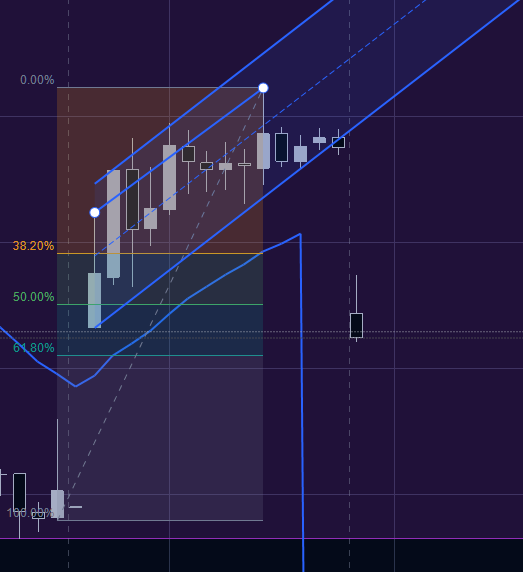
Screenshot 2023-12-04 225822.png (34.17 KiB) Viewed 26985 times
Now it looks like a data problem. :(
Attachments
GER30_v2.zip
(126.28 KiB) Downloaded 887 times
NakedMarkets
Posts: 251
Joined: Tue Feb 22, 2022 11:06 am

Re: EMA went crazy

Post by NakedMarkets »

Hi Khan,

First thanks for your report, and thanks for taking the time to investigate this issue, and providing your backtest file. It helped a lot.
We identified the bug and it is fixed and will be available in the next minor release, likely published tomorrow or Thursday.
However, we want to do additional testing to be sure that this bug is killed properly (by adding additional unit tests to our new testing framework).

Indeed, if you want more information about it, it's only 1 bug with different side-effects, occuring in specific cases.
It happens when the backtest uses different GMT than 0 and with "holes" in the data, where the hole range is the same as the GMT shifting, which is the case in your backtest file, precisely on this day. Another condition is to have a step different from the current timeframe.
Then, the last candle, called the candle in progress can have inconsistencies under some other conditions. One of the side-effect, is the last value of the indicator falling apart. And the symbol GER30, as a stock, is more likely to have "holes" in the data, compared to the Forex data with 24h contiguous data.
So, this is a very specific bug, hard to find but with your backtest file, it was far easier for us to find it.
Thanks !
Khan
Posts: 137
Joined: Wed Feb 22, 2023 10:21 am

Re: EMA went crazy

Post by Khan »

You are welcome!

I set up both backtest files specifically to make your debugging much easier. Glad to hear it helped and also glad to know that it wasn't a heisenbug like winning and losing previous trades having the opposite color. It somehow got fixed along the line, but I don't remember how. It was probably me deleting everything (templates + settings.dat) and starting from scratch. This could have been something insidious like that. Thankfully it wasn't. :)

Did "wrong time remaining to candle close" get also fixed? I can swear that I saw it with EURUSD or something before but I have no evidence.

Thanks for taking the time to explain the bug. You don't have to do it you know. It is also funny that I somehow chose the exact conditions for the bug.

You don't have to rush the release on my account. If you need more time for unit tests and maybe some manual tests, feel free to do so. I can always pick some other pair if the bug gets too bad.
NakedMarkets
Posts: 251
Joined: Tue Feb 22, 2022 11:06 am

Re: EMA went crazy

Post by NakedMarkets »

Hi again Khan,
As expected, we released a new minor version fixing this bug.
Yes, we described a bit the bug in order to give some details since you tried to isolate and identify the issue with us.
Sure, sometimes, the bugs can be hard to track. That's why we designed a new testing framework to avoid them as much as possible.
No problem, we did a full battery of tests to ensure that this bug is properly fixed.
We did not touch code related to a "wrong time remaining to candle close" issue, but we will check this out for sure.
Thanks !
Khan
Posts: 137
Joined: Wed Feb 22, 2023 10:21 am

Re: EMA went crazy

Post by Khan »

Great news.

I'll update and check if we get wrong time remaining to candle close. It was probably due to the same bug but we'll see.

Thanks.
Khan
Posts: 137
Joined: Wed Feb 22, 2023 10:21 am

Re: EMA went crazy

Post by Khan »

I'm sorry to report that I'm still getting the same bug.

I am trading under the same conditions as before: GMT+3, H1 chart and M1 step.
chart_1.png
chart_1.png (15.04 KiB) Viewed 26928 times
In the screenshot above, you can see that current candle starts to count down from 4 hours but it should be 1 hour.
chart_2.png
chart_2.png (67.14 KiB) Viewed 26928 times
After 59 mins pass, candle closes, the EMA tanks and time remaining on the current candle counts down from 30 mins.

This is the exact behavior I reported previously. :(

Backtest attached. It starts from the first screenshot, so you can step forward and see it in action.

I doubt it but can this bug happen because of my backtest file? Logically it shouldn't because EMA and other calculations are done with the new code.
Attachments
GER30.zip
(160.27 KiB) Downloaded 927 times
Khan
Posts: 137
Joined: Wed Feb 22, 2023 10:21 am

Re: EMA went crazy

Post by Khan »

There is another bug, probably related to these.
chart_3.png
chart_3.png (60.83 KiB) Viewed 26925 times
Here, I closed trade #25 somewhere the orange arrow is pointing, but trade history shows it to the left beyond the screen.

Backtest attached as usual.
Attachments
GER30.zip
(169.35 KiB) Downloaded 891 times
NakedMarkets
Posts: 251
Joined: Tue Feb 22, 2022 11:06 am

Re: EMA went crazy

Post by NakedMarkets »

Hello Khan,
We are deeply sorry that the bug is still there despite our efforts to patch it...
We are investigating the issue. Our first analysis shows that the previous patch did the job about the issue of the candle in progress, as our testing framework shows it.
We will keep you updated ASAP about this issue which seems to rely in the GMT shifting this time.
Indeed, this is not in the backtest file, it's a bug within the display routine, to show the candle in progress when there is hole in the data (a gap here), a GMT shift and the step different from the chart timeframe (candle in "progress"). The indicator is just using this last candle (malformed here) as input, making the drop of the last value.

Thanks for your backtest file, as you know, it helps us to solve the problem.
About the second issue, indeed, this is very likely that this is related.

Again, we are very sorry and are doing our best to fix this issue ASAP !
Post Reply